Biofilms are collections of microorganisms joined by an extracellular matrix, and are an important survival mechanism. Cells secrete adhesive molecules that allow them to cling to each other. In a classic “public goods” dilemma, however, cells that don’t secrete these adhesives can still use them. Since these cells don’t have the metabolic cost that the cells producing adhesives do, the producing cells might be seen as having an evolutionary disadvantage.
Assistant Professor Jeffrey Tithof (Mechanical Engineering; MSI PI) and Dr. Saikat Mukherjee (post-doc, Tithof Lab), along with colleagues from Yale University, Wesleyan University, and Dartmouth College, have published a study that investigated how biofilm matrices can be evolutionarily stable even when non-producing cells take advantage of their protective qualities. Their results showed that there is a quantifiable range in which this exploitation takes place. The study, which provides concepts and tools for studying public goods sharing in these systems, was published in the Proceedings of the National Academy of Sciences of the USA: Tai, J-S.B., S. Mukherjee, T. Nero, R. Olson, J. Tithof, C.D. Nadell, J. Yan. Social evolution of shared biofilm matrix components. PNAS 119(27): e2123469119. doi: 10.1073/pnas.2123469119. The authors used MSI for numerical calculations in this project.
Professor Tithof’s lab uses MSI for numerical simulations that complement lab experiments probing important questions at the forefront of fluid mechanics.
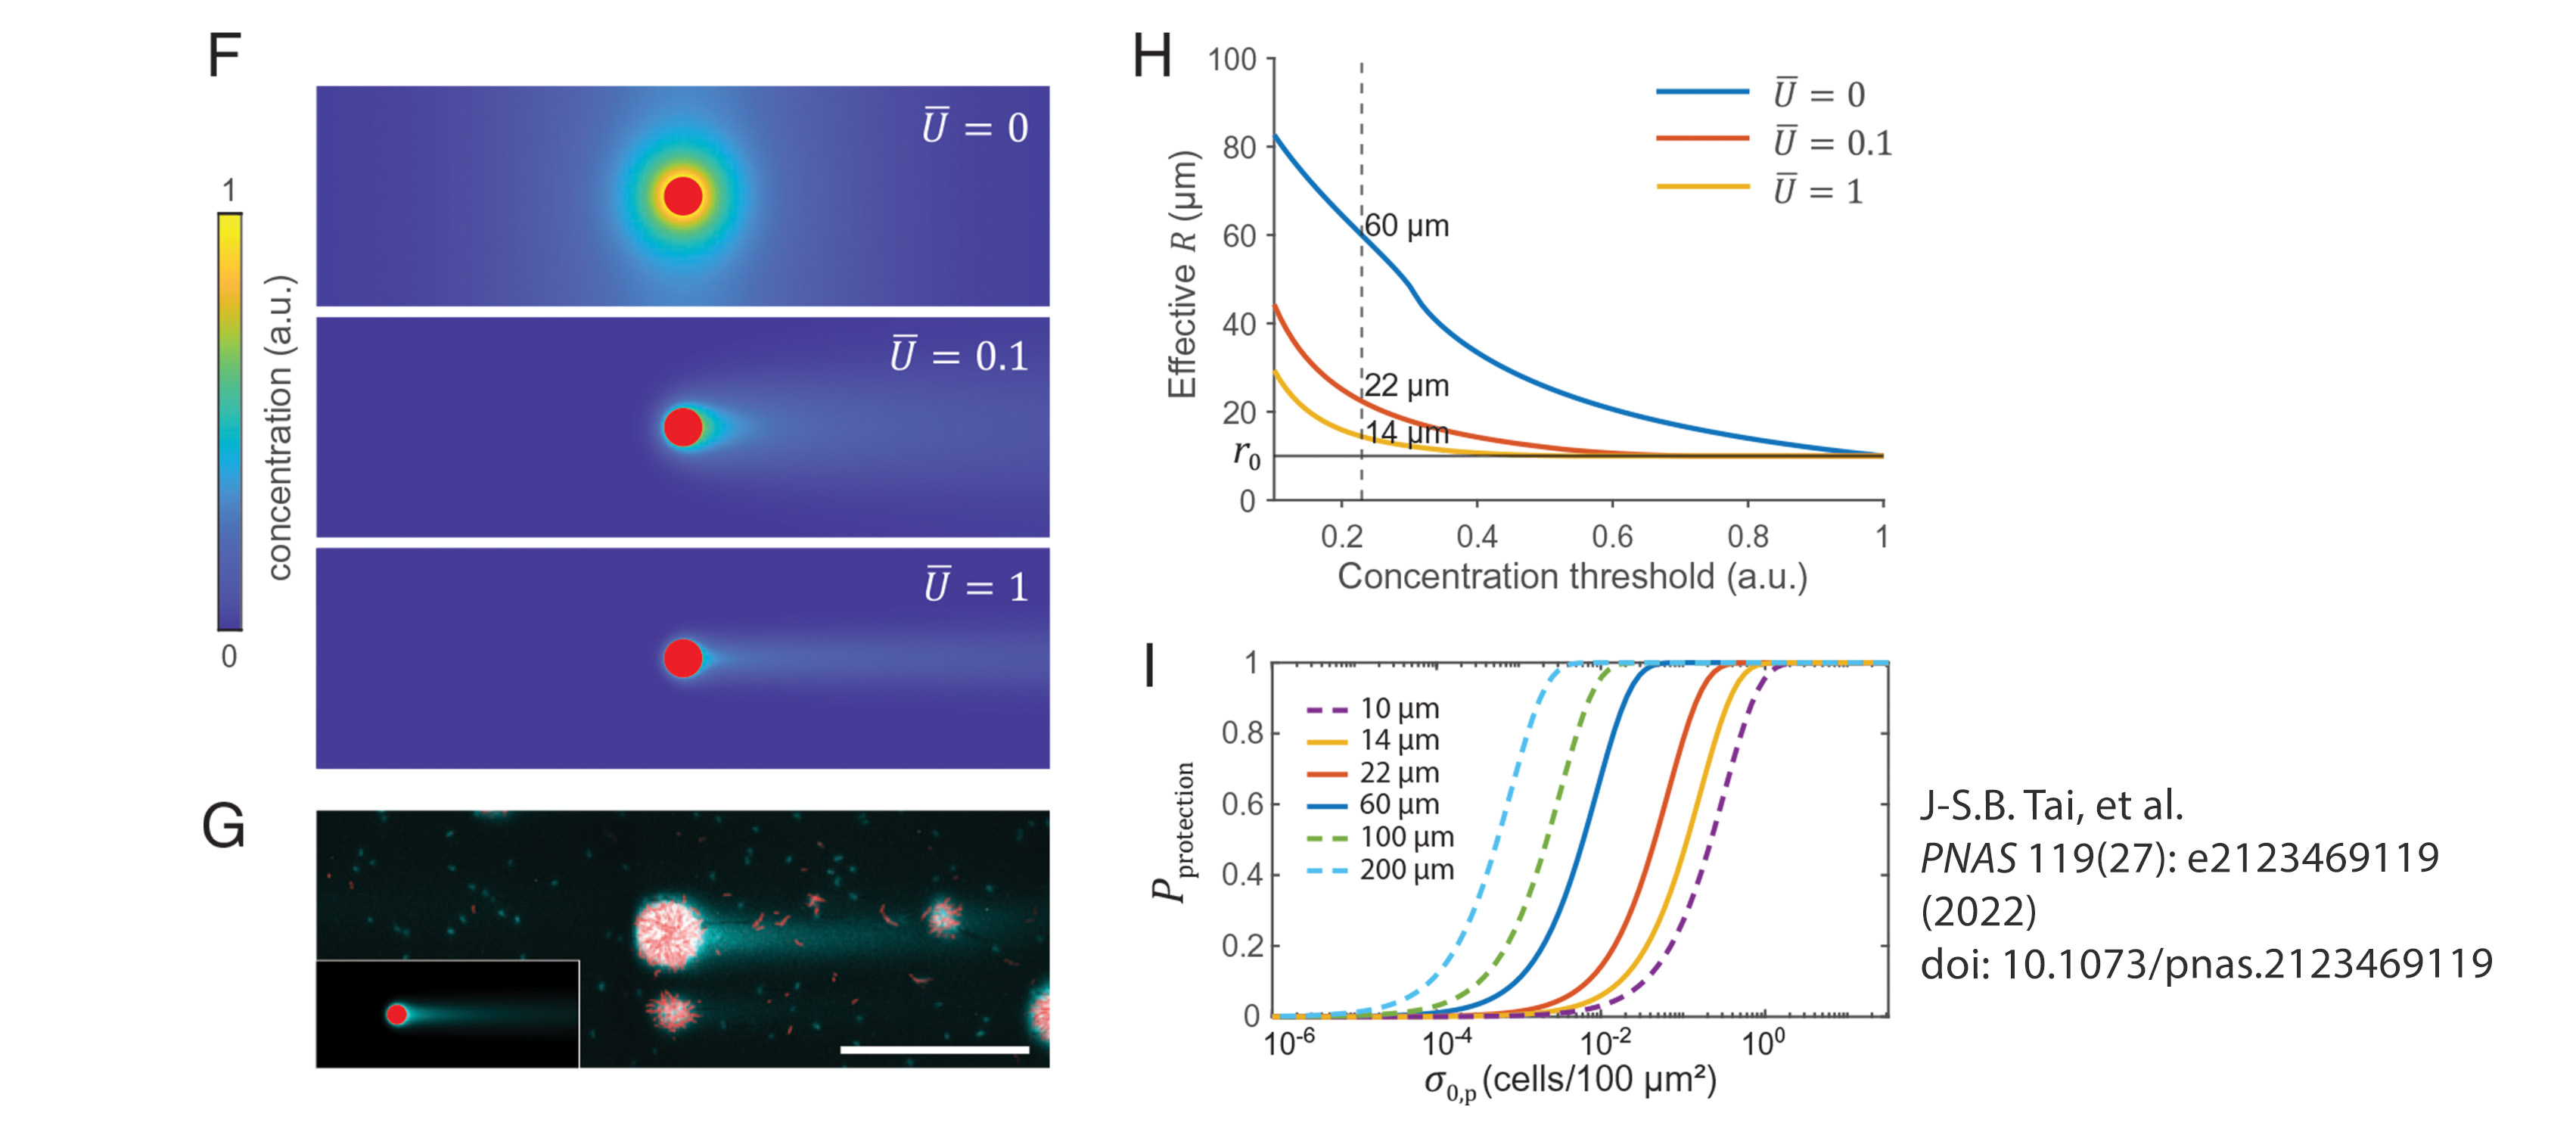
Image description: Flow shifts the competition between producer and cheater by modulating the exploitation range of the adhesion protein. (F) Simulated depth-averaged adhesion protein concentration in a flow chamber at different average flow speeds U. The concentration is normalized by the value at the edge of the producer cluster at U = 0. The red disk corresponds to a producer cluster of radius r0 = 10 μm. (G) Distribution of adhesion protein Bap1 (cyan) around producer clusters (red) at the surface of the flow chamber shown by Cy3-conjugated anti-FLAG antibody staining. The corresponding simulation result is shown in the inset (Lower left). (Scale bar, 100 μm.) (H) Effective R as a function of concentration threshold for protection at different flow rates in simulations. The horizontal line indicates the edge of the producer cluster at r0. A threshold concentration of 0.23 (vertical dashed line) yields R = 60, 22, and 14 μm for U = 0, 0.1, and 1, respectively. (I) Pprotection versus σ0,p calculated for different R values. a.u., arbitrary units; ns, not significant. (Image and description adapted from, J-S.B. Tai, et al. PNAS 119(27): e2123469119 (2022). doi: 10.1073.pnas.2123469119.)