Tropical peatlands are a large natural source of atmospheric methane (CH4), which is a powerful greenhouse gas. However, their impact on climate is not clear.
MSI PI Tim Griffis (professor, Soil, Water, and Climate) and colleagues have used the Energy Exascale Earth System Model (E3SM) Land Model (ELM), an ongoing state-of-the-science model, to study peatlands in the Amazon River Basin. The model has developed new representations of soil hydrology and biogeochemistry and includes a new microbial-functional-group-based CH4 module. It has been used in boreal forest peatlands, but had not previously been applied in tropical peatlands to simulate energy and carbon exchange. In research published in the journal Agricultural and Forest Meteorology, the research team evaluated the ELM performance in simulating energy, carbon dioxide (CO2), and CH4 fluxes of an Amazonian palm swamp peatland in Iquitos, Peru. The research advanced the understanding of biotic controls on the energy and carbon exchange in Amazonian palm swamp peatlands and identified areas for further research to better predict carbon cycle processes and budgets for tropical peatlands. The paper can be found on the journal’s website: F. Yan et al., Evaluation and improvement of the E3SM land model for simulating energy and carbon fluxes in an Amazonian peatland. Agricultural and Forest Meteorology 332:109364 (2023). doi: 10.1016/j.agrformet.2023.109364.
Professor Griffis uses MSI to run several computational models in research that will answer important questions related to carbon, water, and nitrogen cycling at a wide variety of spatial scales.
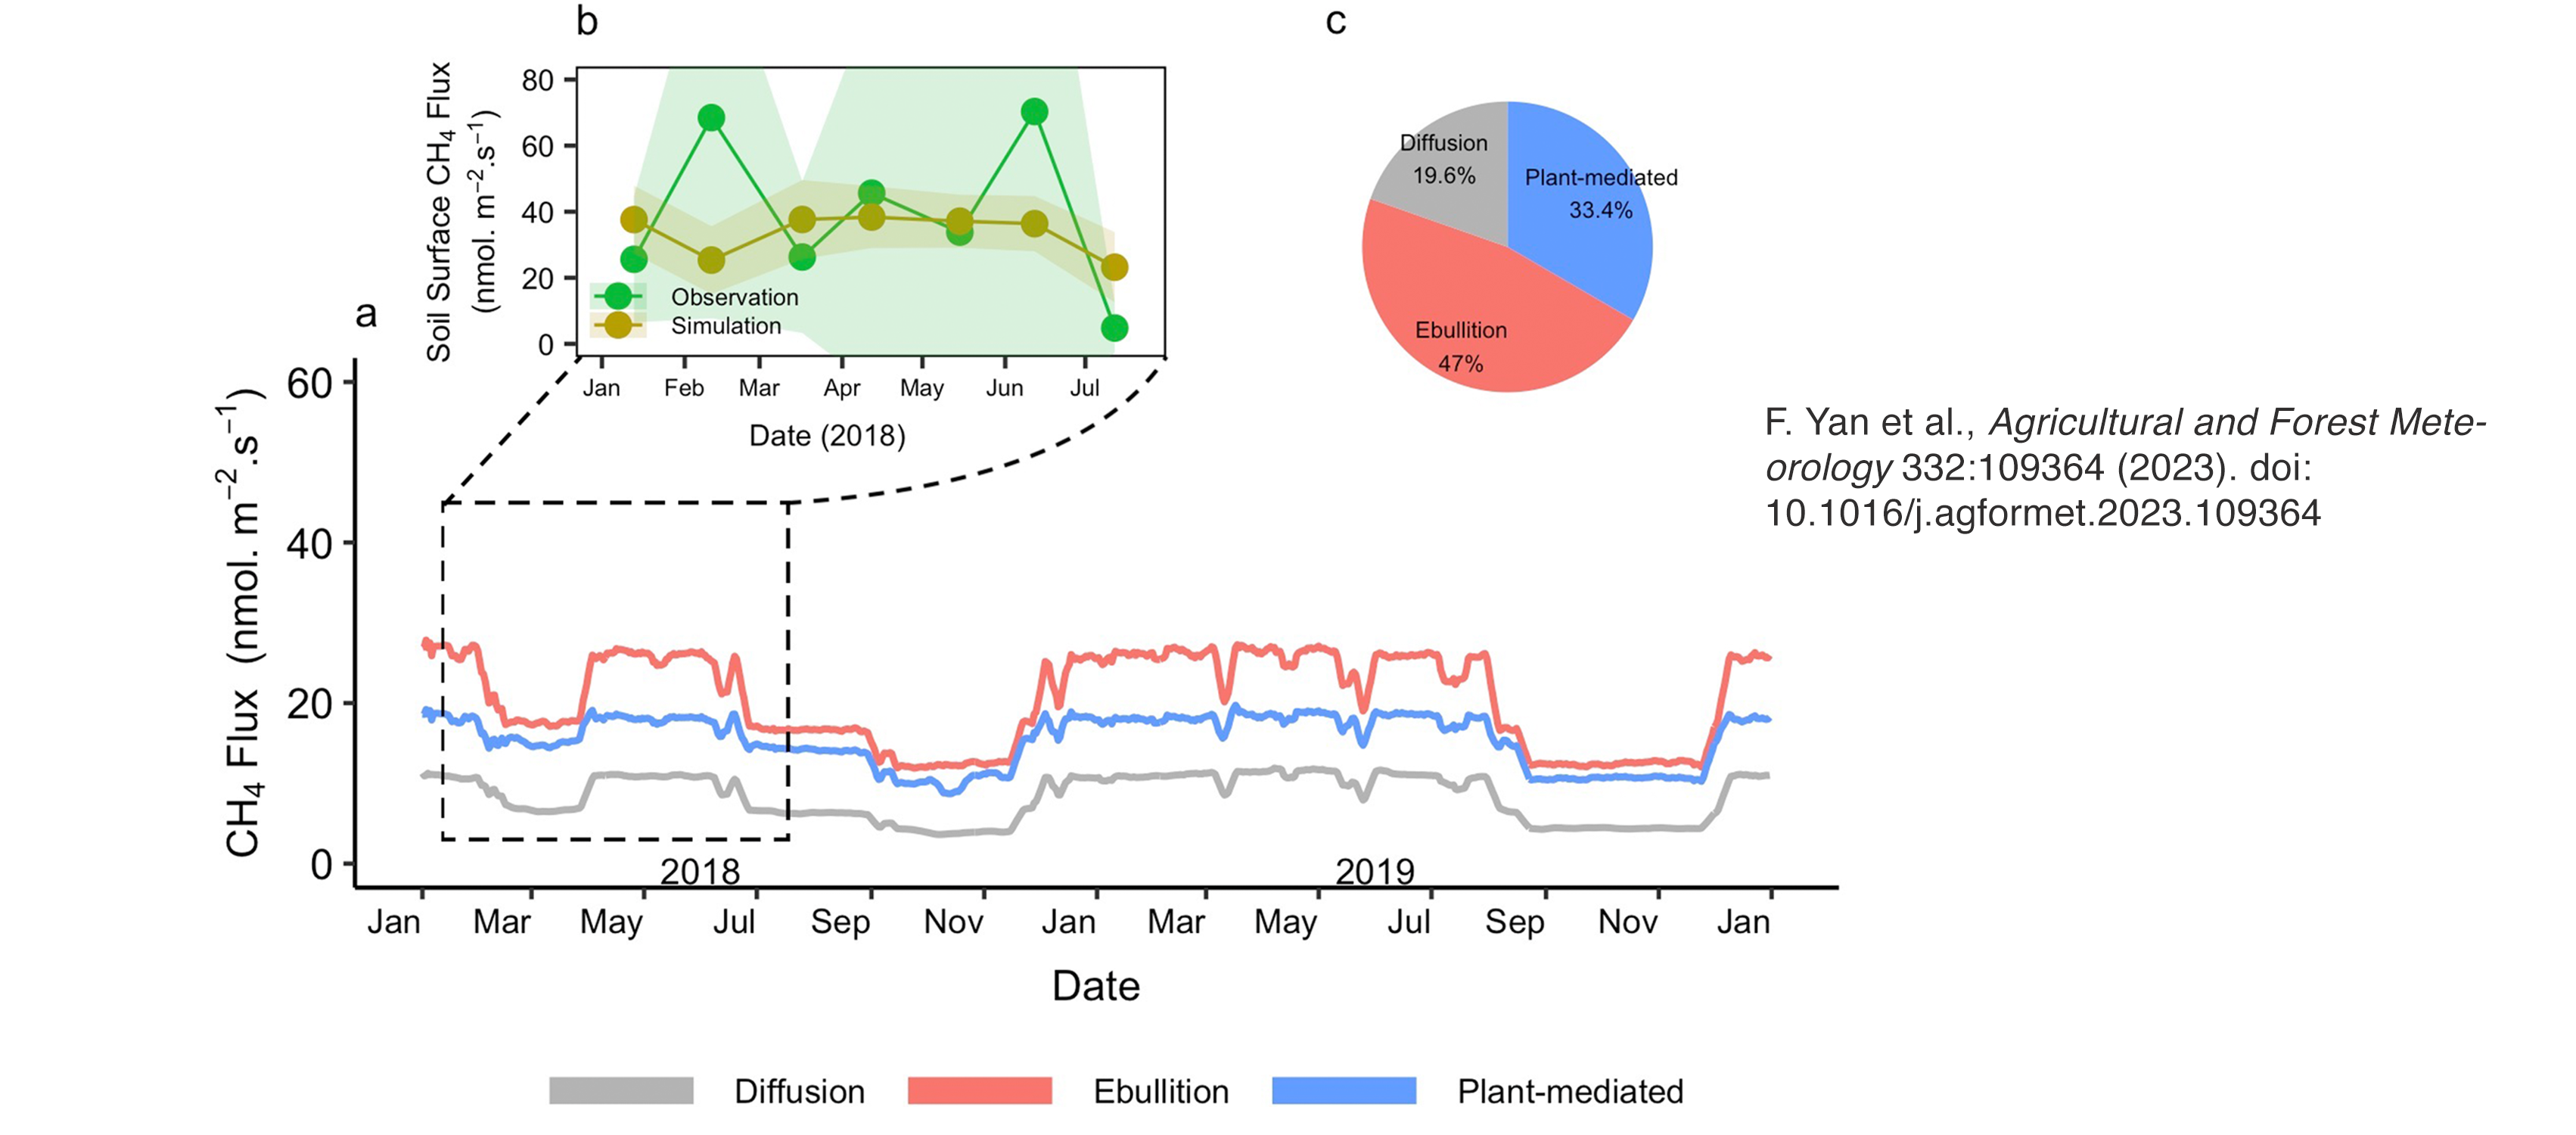
Image description: The seasonal patterns of simulated daily (5-day moving average) CH4 transport pathways in 2018 and 2019 (a). b presents a zoom of the plot for simulated midmonthly soil surface CH4 fluxes (by summing the simulated CH4 fluxes of soil diffusion and ebullition) in the period January 15 to July 15 of 2018, with corresponding soil chamber observations from Hergoualc’h et al. (2020) (Shaded error bars represent standard deviation). The pie chart shows the total contribution for each pathway to the annual sum of CH4 emissions (c). Image and description, F. Yan et al., Evaluation and improvement of the E3SM land model for simulating energy and carbon fluxes in an Amazonian peatland. Agricultural and Forest Meteorology 332:109364 (2023). doi: 10.1016/j.agrformet.2023.109364.